top of page
TALNT
Overview
A set of realtime data and people analytics tools designed for the Finance sector to see moving patterns within industry
AI ANALYTICAL TOOLS
FOR THE FINANCIAL SECTOR
SYSTEM
TOOLS.
People moves
by industry.


OVERALL
A SET OF CUSTOM TAILORED TOOLS TO TRACK MOVES WITHIN EACH INDUSTRY + SECTOR.

USER
TOOLS
LIVE DATA VISUALISATION REPRESENTING PEOPLE MOVES WITHIN INDUSTRY SECTORS.

DASHBOARD SKETCHES & WIREFRAMES
A user-configurable dashboard to indicate a detailed analysis into each sector of any market at any time.


EFFICIENCY FIRST TOOLS
STAY INFORMED
STAY AHEAD
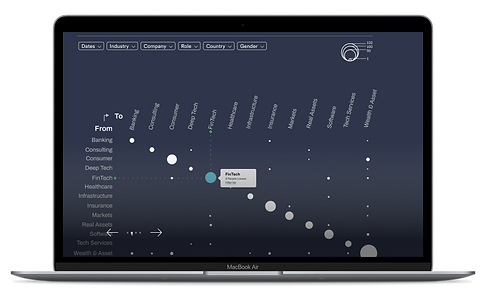
Dashboard
Quick finds / insight planning
Scatter plot to show industry's people move trajectories over time.
MODULAR
BLOCKS
The importance being on simplicity and clarity of the visulations to quickly dertemine behaviours and patterns to be recognised in a glance.


SOLUTION
A set of data visualisation tools to quickly understand and estimate realtime behaviours to run on desktop and mobile within a dashboard environment.
AI:MAP
TOOLS.

bottom of page